


.svg)
Scale and speed: why the climate needs electric vehicles
We need great urban design that encourages electric public and active transport for safe neighbourhoods and healthy lifestyles, but we also need electric cars for rapid decarbonisation and to address all the vehicle travel we realistically aren’t going to shift or avoid. These two things can be complementary.


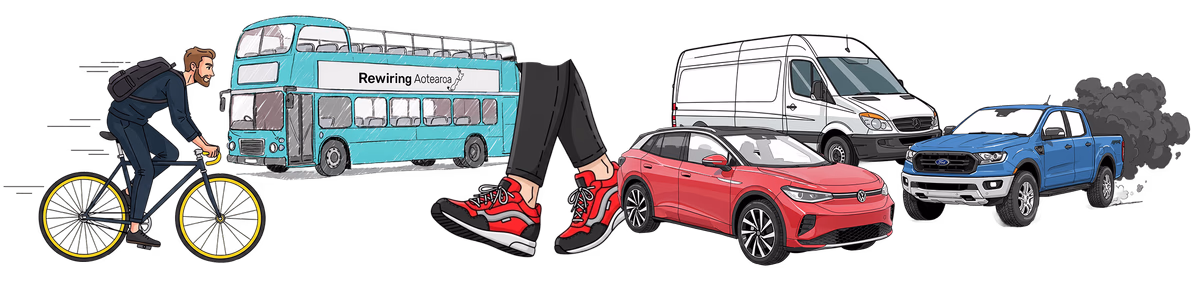
At Rewiring Aotearoa, we're big fans of electric transport in all its forms, including cars. We sometimes get asked why we focus on EVs over other ways to reduce carbon emissions from transport, like getting more people walking, cycling and using public transport. It’s a fair question, and in this explainer we’ll take a data-driven approach to answering it.
Here’s the short version:
- We agree New Zealand has great opportunities to shift how people get around in our cities and towns, which can cut emissions and bring a host of other benefits for health, urban environments, and our economy. The more of that the better, and we support the groups doing that mahi around the country.
- But when it comes to cutting our transport emissions, these opportunities are limited in two key respects: scale and speed.
- Even if New Zealand were to radically transform our urban transport systems, we’d still have a lot of car travel left to decarbonise. For evidence of this we can look to other countries that are cycling and public transport havens, yet still do a considerable amount of driving.
- Electrification is an essential backbone of a zero emissions transport system. This is because car travel accounts for over 90% of total household travel kilometres in Aotearoa, and most of this is in longer trips that are typically difficult to switch to other travel modes.
- While EVs don’t solve every problem associated with the automobile, they will bring huge benefits. They’re cheaper, cleaner, and quieter than the 120,000 new petrol & diesel cars that are currently sold every year in New Zealand. In the future, their batteries will be connected to homes and the grid to provide valuable energy storage for better community resilience.
Jump to sections:
- Cars got 99 problems but emissions are (the biggest) one
- Getting around in Aotearoa
- Looking abroad
- Going the distance
- Kicking the tyres on a mode shift revolution
- We need to electrify to decarbonise
- How fast can we electrify?
- The wider benefits of EVs
- Wrapping up
TLDR? Check out the infographic.
Let's dive in.
Cars got 99 problems but emissions are (the biggest) one
Whichever way you look at it, cars are a big part of the emissions problem in New Zealand and the world at large. As shown in our Electric Homes report, cars use around 60% of a household’s total energy and are the single biggest source of household emissions.

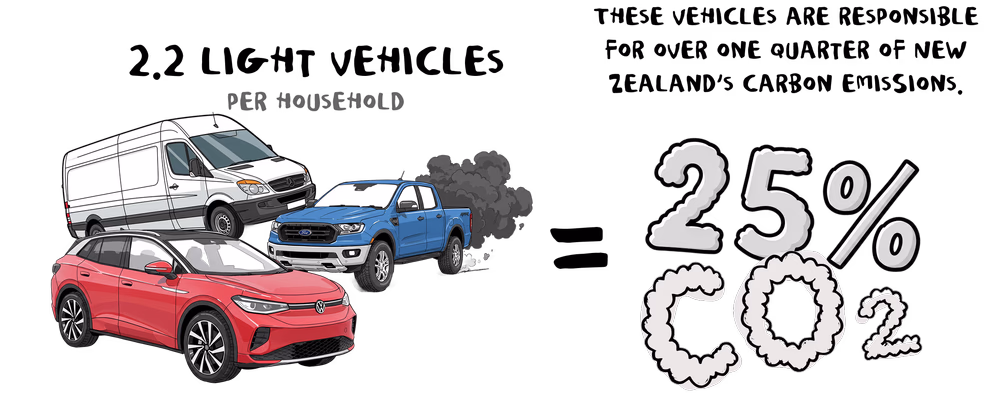
From a national standpoint, light vehicles (that’s cars, vans, and utes) cause around 28% of New Zealand’s CO2 emissions and 11% of our total greenhouse gas emissions (including agriculture). Globally, passenger vehicles cause around 11% of energy CO2 emissions.
Cars are an integral part of modern life, and for good reason: they are incredible mobility machines that enable humans to get places and do things they couldn’t do otherwise. But many will point out that cars - or rather, our excessive dependence on cars and the way we have built our urban environments around them - also come with a litany of problems.
These include:
- Negative health impacts - through local air and noise pollution, injuries and deaths from road accidents, and by contributing to sedentary lifestyles.
- The high cost of urban sprawl, which consumes a lot of land and other resources.
- Lower life satisfaction, especially from long commutes.
For these reasons and more, it’s in New Zealand’s interests to improve our transport and land use policies to encourage urban intensification and give people better travel choices beyond the car.
But how far might this get us in tackling climate change, the most urgent problem we face? For starters, let’s look at how, and how much, New Zealanders travel today.
Getting around in Aotearoa
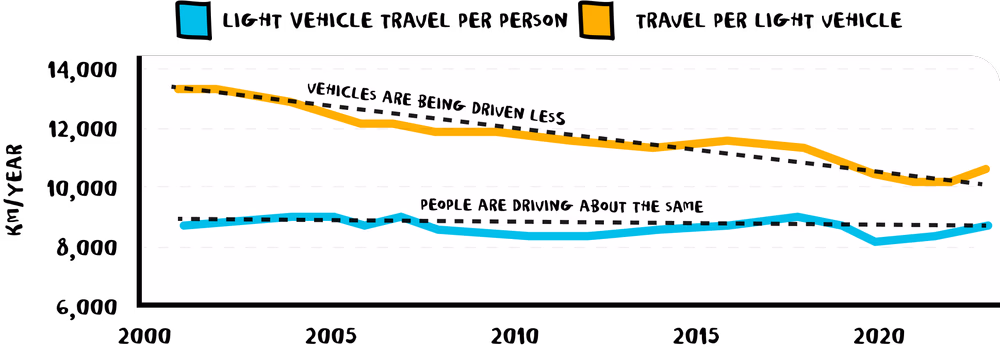
New Zealand has one of the highest car ownership rates in the world. There are around 3.5 million small/medium cars, 500k utes, and 200k vans in our vehicle fleet. That is around 1.8 cars per household, or 2.2 light vehicles including the vans and utes - many of which are also used for household travel. Those numbers have been steadily rising for decades.
Despite that growth in the number of vehicles, the amount the average person travels by light vehicle has stayed relatively flat at about 8,500 km each year. In other words, total light vehicle travel has grown at about the same rate as population. As the chart below shows, the annual travel per light vehicle has fallen over time to around 11,000 km today. We are acquiring more vehicles but, on average, using them less.
What about other ways of getting around? The next chart shows how much New Zealanders travel by different land transport modes, using three different metrics: share of travel time, share of trip legs*, and share of travel distance. Cars dominate on all measures, especially when it comes to travel distance – which is closely tied to carbon emissions. Car travel accounts for nearly 95% of total travel distance (passenger-kilometres), with around two-thirds as the driver.
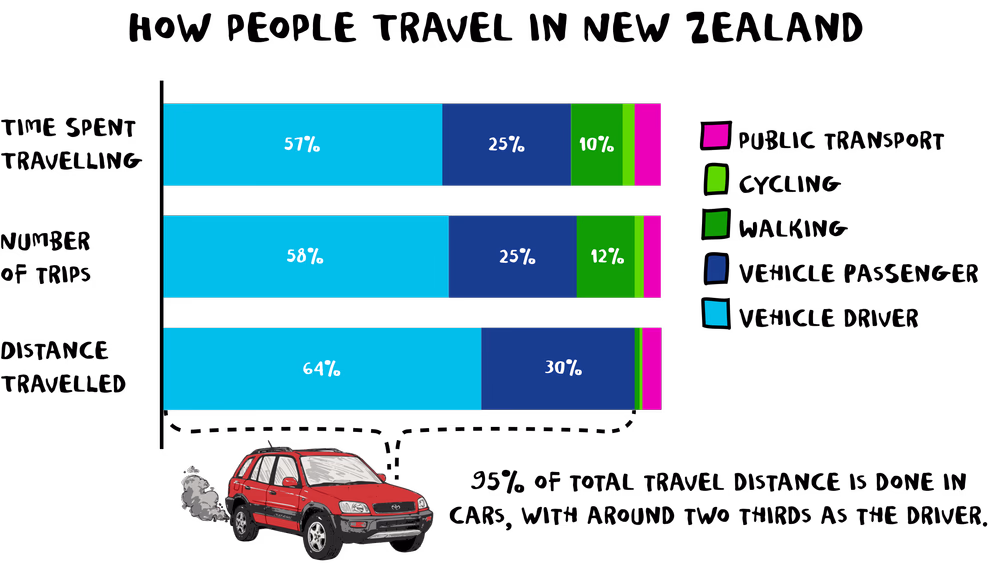
You can see here the importance of trip length. Walking accounts for around 12% of trip legs, but only 1.2% of travel distance. The average trip leg distance sits around 10 km for driving (and public transport), but only 1 km for walking, and 4 km for cycling. This is a key point we’ll come back to, but first, let’s take a look at how we compare with some of our international friends.
Looking abroad
Compared with international best practice, we know that New Zealand’s levels of public transport, walking and cycling are not exactly flattering. Think cycling havens like the Netherlands (where more than a quarter of all journeys are taken by bike) and Denmark (not far behind at 15% of all trips), and public transport utopias like Japan (where nearly one-third of passenger-kilometres are by train). The following chart may therefore come as a bit of surprise.**

What this shows is that, at the national level, the amount of vehicle travel per capita in many such places is not so far below New Zealand’s. In France and Denmark it’s virtually the same as us. In the UK it’s around 15% lower, and in the Netherlands around 20% lower. Japan - with the world’s highest share of travel by rail - is in a bit of a league of its own at 40% lower (we should keep in mind here that Japan and the Netherlands are among the most densely populated countries in the world).
The data show higher levels of cycling and public transport - especially trains - are clearly associated with less vehicle travel and emissions. But it suggests that even if New Zealand could catch up with the kind of cycling and public transport levels of a European country, this might only reduce vehicle travel in the ballpark of 10-20%. What’s going on? A big part of the answer lies in the disproportionate impact of longer trips.
Going the distance
Earlier, we talked about the average trip distances for different travel modes, showing perhaps unsurprisingly that driving trips are on average much longer than walking and cycling trips, and pretty similar distance to public transport trips. Averages only tell us so much. We need to look at the distribution of trips by distance.
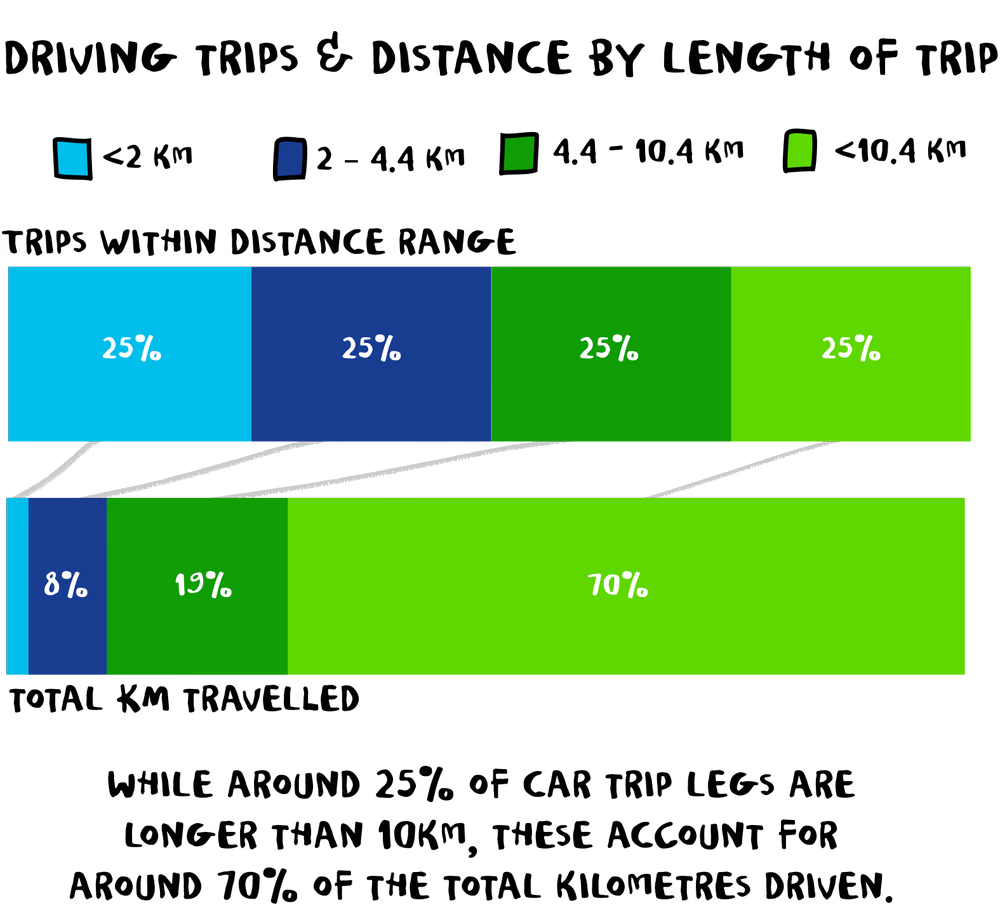
Data from the latest Household Travel Survey found that roughly three-quarters of all car trip legs are under 10 km (see the upper bar in the chart). With a bit of math, we can estimate how this translates to total distance travelled (the lower bar). We find that while only around 25% of car trip legs are longer than 10 km, these account for around 70% of the total kilometres. Conversely, while about 50% of car trips are relatively short at less than 5 km, these trips only account for about 11% of total kilometres.
This is a critical point. The same data show almost all walking trip legs are less than 2 km, and around three-quarters of cycling trip legs are under 5 km (taking 20-30 minutes at average speeds). Now some people are willing and able to bike longer distances, and e-bikes are extending that range. But for now, the sobering upshot is this: nearly 90% of car travel is at lengths greater than most walking and cycling trips.
What about public transport? As we’ve seen, the average trip leg length is similar to driving. But for public transport the distribution looks more like a bell curve, while for driving it’s skewed towards a small percentage of very long trips (see this report if you want a more granular deep dive). For trips in the middle, the barriers for switching to public transport are more around the time taken (especially for buses) and how well it serves the specific trip destination and purpose (or in many cases, whether it exists at all).
The picture these data reveal may help explain what we saw earlier, with car ownership growing while the amount the average person drives has not. Even if people aren’t using their car much day-to-day, they might still want it for less frequent longer trips. Car-sharing schemes can offer a more efficient solution here. But this suggests simply getting people out of cars for short trips might not go as far as we’d think to reduce car ownership.
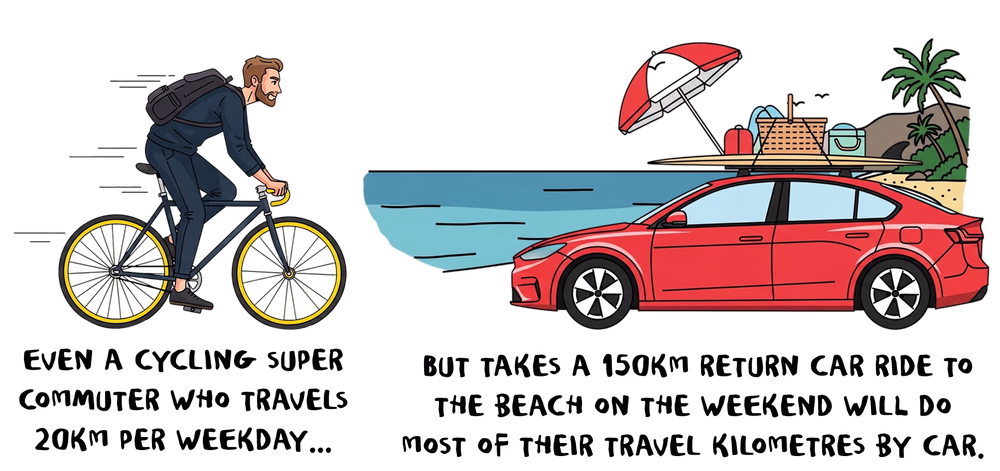
To illustrate this with an example, let’s imagine a cycling super-commuter. They bike 10 km to and from work 5 days a week, covering around 100 km. However, on the weekend, they go to a beach that’s a 1 hour drive away, a 150 km round trip. Even though they bike most of the time, the majority of their travel kilometres are done in a car. While they are eliminating emissions from the 100 km they ride on their bike for work, the 150 km from that one weekend beach trip is where most of their transport emissions will come from.
Another factor here is holiday travel. One big roadie from say Christchurch to Wānaka and back will rack up close to 1,000 km, or around 10% of what the average car travels each year. And a final thing to note is the data here doesn’t include travel by professional drivers, like taxis and courier vans. For obvious reasons, those kinds of trips are going to be harder to shift.
Kicking the tyres on a mode shift revolution
With all that data in mind, let’s run some numbers on how much we might be able to reduce vehicle travel in Aotearoa through changes in how people travel. The prescription would be improving and investing more in public transport and cycling infrastructure, disincentivising driving trips (e.g. through congestion charging, reducing road space, and increasing car parking prices), and encouraging urban intensification and growth in walkable neighbourhoods.
Let’s imagine a scenario in which we double the share of walking trips, triple the share of public transport trips, and 5x the share of cycling trips across the whole country. We’ll assume the average trip lengths for each mode don’t change, and that the people switching would be a combination of car drivers and passengers.***
All together, the share of trips taken by walking, cycling or public transport would grow from around 17% to 42%. Looking at the trip length distributions, this would cut the number of car trips under 2 km by around three-quarters and those under 5 km by around half, plus around 15% of trips longer than 5 km.
Because these are national figures, the changes in main urban centres would have to be significantly greater. We’re talking about a dramatic transformation of our cities and towns.
But here’s the kicker: while the number of household vehicle trips would fall by 30%, the distance driven would only fall by around 12%. That’s because most of the kilometres are in longer trips.
This isn’t the full story yet though. First, we haven’t fully considered the potential for changes in urban form. What if most new houses are built in places close to where people work and play? Let’s assume these new households only make half as many trips longer than 10 km compared to today’s average. At projected population growth around 1% per year, the average household’s vehicle kilometres would reduce by about 0.35% per year, or 3.5% over a decade.
Second, the combined effect of all these changes would have a wider impact on travel patterns than the relatively simple calculations above reflect. For example, some extra car trips could disappear as parents no longer need to drive their kids to school or sports practice if they can safely bike or take a bus. Some long car trips could be exchanged for shorter active and public transport trips as people find alternative shops, cafes, and activities closer to home. On the other hand, making it easier and more attractive to walk, bike and use public transport might add some new trips rather than displacing a car trip (this is known as induced demand). All of this is uncertain and hard to quantify, but let’s generously assume a further 5% reduction in vehicle kilometres.
Combining all this, we’re looking at about a 20% reduction in average household vehicle kilometres (that’s assuming we could achieve all that mode shift over the decade to 2035). As we saw earlier in looking abroad, that would put us towards the better end of European countries on vehicle travel per capita.
But wait. There are a couple more kickers…
First, we haven’t considered work vehicle trips, so the overall reduction in light vehicle travel would be smaller.
Second, and more importantly, that ~20% reduction is on travel per household or per capita. We need to factor in population growth of around 1% per year. This would mean achieving the ambitious scenario above would only reduce total light vehicle travel, and emissions, by about 10% by 2035.
Sobering. A 10% reduction is not to be sniffed at, but it doesn’t get us close to where we need to be. Where does that leave us?
We need to electrify to decarbonise
To recap, there are great reasons for New Zealand to work to shift how people get around in our cities and towns. This will cut emissions at the same time as bringing a host of other benefits for health, urban environments, and our economy. But when it comes to cutting our transport emissions, these opportunities are limited in two key respects: scale and speed.
Generally speaking, the opportunities for quicker wins (like rolling out bike and bus lanes) are limited in scale of emissions reductions, because they’ll only compete for relatively short trips. As we’ve seen, the lion’s share of our transport emissions come from longer trips.
Opportunities with greater scale (like trains, and redesigning cities to reduce the distances people need to travel) will take much longer to deliver or take effect. And for a significant share of New Zealanders and their travel needs – particularly those in rural settings – none of these will provide a viable alternative to driving.
This is where EVs come in.
Electrification is an essential backbone of a zero emissions transport system. EVs provide a solution for all the travel that can’t or won’t be shifted to other modes, including work travel in vans, utes, and trucks.
Switching to EVs makes the transport system we have about four times as energy efficient, and that energy can come from clean, zero-emissions sources. EV owners can avoid over 42,000 kg of emissions over 15 years if charged with solar when compared with the average petrol car (see Electric Homes).
The chart below shows how the total energy use by light vehicles compares between (i) the status quo, (ii) an even more ambitious mode shift scenario (***) (iii) fully electrifying the light vehicle fleet, and (iv) both approaches combined. It shows how electrifying vehicles gives the biggest step change in energy consumption (and therefore emissions).
How fast can we electrify?
When it comes to climate change, time is of the essence: we don’t have decades to work with, and the faster we bend the curve down the lower the warming we ultimately cause. Every year, New Zealanders buy over 120,000 new petrol & diesel cars, locking in huge emissions for at least the following decade. This has to change, fast.
As we’ve talked about in a previous Watt Now, Norway went from virtually no one having an EV in 2010 (other than the guy who sings Take on Me) to over 90% of new car sales being fully electric in 2024. Considering the vast improvements in EV and battery technology and costs since then, we can make this transition happen faster now. That’s true even though New Zealand’s vehicle fleet turnover is relatively slow.

The Climate Change Commission’s modelling finds that if we rapidly increase EV sales to reach about 80% of cars entering the fleet by 2030 (that includes used imports), then EVs would make up nearly half of the car fleet by 2035. More importantly, EVs would account for around 60% of total car travel, because newer cars are driven more and average usage declines over a vehicle’s lifetime. This modelling factors in the real-world dynamics of the New Zealand vehicle fleet.
This means that by rapidly increasing EV uptake, we could cut emissions from cars in half in roughly a decade. By 2050, ideally sooner, we could electrify everything and transport emissions will be a problem of the past.
Of course, we can cut emissions even faster and capture the most benefits by doing both electrification and mode shift. These solutions shouldn’t be pitted against one another. The only beneficiaries of that are the oil companies and laggard car companies who are actively lobbying against EV adoption because they want to keep society hooked on buying their fossil fuel products for as long as possible. You can bet that they’ll be doing what they can behind the scenes to pour fuel on that fire.
The wider benefits of EVs
While EVs don’t solve every problem associated with the automobile, they will bring huge benefits compared to the status quo of petrol and diesel vehicles:
- They’re cheaper - our Electric Homes report shows they could save the average household between $10,000 and $20,000 over the lifetime of the vehicle, depending on how it is charged.
- They mean less money being sent overseas to buy oil, which will benefit the New Zealand economy.
- They’re cleaner and quieter, reducing air and noise pollution and improving urban environments.
- They’ll also provide valuable energy storage to homes and the grid, adding value to the 95% of time cars typically spend not moving and enhancing community resilience.
- Their supply chain is highly recyclable, and the operating emissions savings far outweigh their embodied manufacturing emissions.

If EVs are cheaper, will people drive them more? That’s a core assumption of a recent study from University of Otago which has garnered media attention, leading to the conclusion that the EV transition will lead to mixed health impacts. It’s a valid claim: generally when something is cheaper, we consume more of it - and some international evidence supports it.
First, it’s important to keep this in perspective. All solutions involve trade-offs, but we believe climate change is the biggest problem we are facing. The study doesn’t consider the negative health effects of climate change itself - including mental health - nor the economic benefits we describe above.
Second, more car travel isn’t a foregone conclusion of more EVs, it’s a choice we can influence through policies and urban design. The study itself notes that travel increases could be limited through road user charging. The same would apply to all the other measures we discussed earlier, like congestion charging, car park pricing, and making walking, cycling, and public transport more available and more attractive. Again, this highlights the importance of an all-of-the-above approach to decarbonising transport.
It should also be acknowledged that while car trips come with negative externalities, they also represent a benefit for those taking the trip. If EVs do lead to more driving it will likely be in large part from those on lower-incomes who are more price sensitive, and may forgo important trips that would improve their life today (to a better work opportunity further away, a recreational activity, etc.) because they can’t afford it. There is an important point here on transport equity, and EVs can be part of the solution to this alongside other actions to give people better, cheaper transport options.
Wrapping up
Ultimately, it’s a similar story here as with making our homes and industries more energy efficient. Energy efficiency is great for a range of reasons and it’s part of the climate solution, but we can’t efficiency our way to zero emissions. Likewise, we can’t urban design our way there – and certainly not as fast as we need to.
We need both great urban design that encourages public and active transport for safe neighbourhoods and healthy lifestyles, and EVs for rapid decarbonisation and to address all the vehicle travel we realistically aren’t going to shift or avoid. These objectives can be complementary, and EVs shouldn’t be seen as the enemy of mode shift.
*A trip leg means a single leg of a journey with no stops or changes in travel mode. A journey might involve several trip legs on different modes (e.g. walking to catch the bus), or simply a return trip.
** It’s hard to find comparable data on light vehicle travel in different countries. It’s not always clear which light vehicle types are included or not, and the EU only reports by passenger-kilometres rather than vehicle-kilometres. The chart shows the total kilometres by all road vehicles (including trucks and buses) per capita. This gives a pretty good indication of differences in light vehicle travel. In New Zealand, light vehicles account for around 92% of total vehicle kilometres and the data we’ve seen suggests it’s pretty similar in other countries - for example, in the UK it is 94%.
*** More ambitious mode shift scenario: This is based on the scenario modelled in the Auckland Transport Emissions Reduction Pathway (TERP). To scale this to the rest of the country, we’ve assumed Tier 1 urban areas (e.g. Christchurch) achieve the same level of change as Auckland’s TERP, Tier 2 areas (e.g. Palmerston North) achieve 50% of that, and Tier 3 / rural areas achieve 10% of that. This results in roughly 2x walking mode share, 12x cycling mode share, 4x public transport mode share, and a 10% reduction in total passenger kilometres travelled when considered nationwide.
Related posts
More Watt Now? posts from Rewiring Aotearoa

Solving the dry year
Read More
.png)
Sun in a socket: plug-in solar
Read More
The case for energy loans
Read More

A bad case of gas
Read More
Scale and speed: why the climate needs electric vehicles
Read More

A future with two visions
Read More

Show me the money: the economics of going electric
Read More

Why electric vehicles matter
Read More

Why solar makes sense
Read More

Why going electric wins on emissions
Read More

Energy use in New Zealand
Read More
Closing The Loop
Read More
Electricity means efficiency
Read More
